Better Seal and Sea Lion Surveys Through GIS
By Bryan Wright, Oregon Department of Fish and Wildlife
Editor’s note: When members of the Marine Mammal Program staff of the Oregon Department of Fish and Wildlife (ODFW) changed from film to digital image capture for their annual aerial pinniped survey, they used this opportunity to more efficiently conduct these surveys, improve quality control and data management, and streamline image archiving by incorporating GIS.
Nearly every year since the late 1970s, ODFW has flown aerial photo surveys of the Oregon coast to monitor seal and sea lion (pinniped) populations. These animals had been hunted and harassed to the point that their numbers were low in much of Oregon. In 1972, they received federal protection under the Marine Mammal Protection Act. Aerial photographs of pinnipeds taken during each breeding season have allowed biologists to monitor the recovery of these populations and document changes in their distribution and abundance.
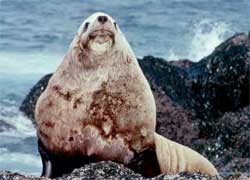
This male Steller sea lion is part of the seal and sea
lion populations in Oregon that are monitored through
annual aerial photographic photo surveys
Over several weeks each spring and summer, ODFW’s marine mammal biologist Robin Brown takes more than a thousand photographs of harbor seals, elephant seals, Steller sea lions, and California sea lions as they lie on beaches and offshore rocks at haul-out sites along the Oregon coast. Brown has the pilot tilt the plane on its axis and make tight, stomach-turning spirals over each site so that he can take near-vertical pictures out the window while flying less than 1,000 feet above the ground.
In 2002, Brown traded in his 35 mm conventional film camera for a digital one. Now instead of having to juggle a dozen rolls of slide film for each survey, he can store all the images on a single storage device and keep a season’s worth of images on a couple of CD-ROMs. The turnaround time—from taking the pictures in the field to viewing them—was cut from several weeks to less than a day. While these gains in efficiency were readily apparent, what wasn’t so clear was how best to manage these digital images and count the animals they contained.
The old method of counting pinnipeds from slides involved projecting each image onto a large piece of paper hung on a wall. With a clicker-counter in one hand and a pencil in the other, a trained counter painstakingly accounted for each animal. The counter tried to track individual animals by placing a mark for each one on the paper backdrop. However, pencil marks were erased after each slide so any physical record of what had been counted was lost. Typically each haul-out site was documented by several overlapping images, which required going back and forth between images until the counter was confident all animals at each haul-out site had been counted exactly once. If there was any question regarding species identification, work was stopped until a second opinion was found.
Also, when viewed through a 400 mm zoom lens, most of the more than 100 haul-out sites along the Oregon coast look alike. Identifying each site correctly required reading carefully recorded flight notes that correlated the slide numbers for each roll of film with the correct location. Not only did these factors raise quality control issues but also made training new counters difficult.

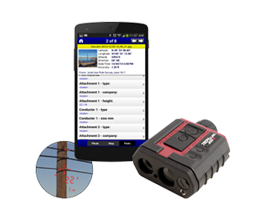
Tiling overlapping images and permanently storing
counts in a point layer provide a measure of quality
control that was not previously possible.
After going digital, Marine Mammal Program staff members decided that instead of simply replacing the slide projector with a computer and continuing to count the old-fashioned way, they would find out if a GIS-based approach was useful. They turned to Brady Callahan, a GIS analyst for ODFW, who helped them create an efficient process using ArcGIS to manage, display, count, and archive the growing catalog of digital survey images. (Callahan is now the GIS program coordinator for Oregon’s Parks and Recreation Department.)
The process began with assembling and displaying base layers of the Oregon coast. These consisted of United States Geological Survey Digital Raster Graphics (DRGs) and digital orthophoto quadrangles (DOQs). A point layer was created by having Brown identify haul-out sites on these base layers. Brown also began creating GPS track logs of his flights to document exactly when and where his surveys occurred.
The next step was to deal with the digital images. Instead of simply hyperlinking images, the staff wanted images to automatically load to the location where they were taken. This problem was solved by Callahan. He wrote a Visual Basic program and used a third party software program, GPS-Photo Link, from ESRI business partner GeoSpatial Experts. Each image is georeferenced to the location where it was taken by matching the time stamps from the GPS track log with those encoded in the digital images and creating a world referencing file for the images based on the GPS coordinates.
Once the images are loaded, the next task is tiling overlapping images together to avoid double-counting animals that appear in more than one image. This is done by manually georeferencing each image to create a composite picture of the entire haul-out site. At the same time, the brightness or contrast of images can be manipulated, which sometimes reveals animals that would have been otherwise hidden in shadow.
After the mosaic image of a haul-out is created, the final task is identifying and counting animals. Simply pointing and clicking on each animal stores the result in the appropriate point layer. Attributes, such as species, age class, and location, can easily be added to each record. Records are simply tallied to obtain the total count.
Switching to a GIS-based approach to process aerial survey imagery has resulted in more accurate and efficient counts of seals and sea lions in Oregon. It has also allowed for more effective quality control, data management, and archiving. With its improved raster management, upgrading to ArcGIS 9 has led to a smoother implementation of these methods for the 2004 surveys. Since completing this project, the Marine Mammal Program has incorporated GIS into other aspects of its work—creating a digital atlas of seal and sea lion haul-out sites, tracking satellite-tagged California sea lions, and helping develop statistical survey sampling designs. For more information on the use of GIS in ODFW’s Marine Mammal Program, contact
Bryan Wright, Biometrician
Oregon Department of Fish and Wildlife, Marine Resources Program
E-mail: bryan.e.wright@state.or.us
or
Brady Callahan, GIS Program Coordinator
Oregon Parks and Recreation Department
E-mail: brady.callahan@state.or.us
About the Author
Bryan Wright holds a bachelor of science degree in wildlife and a master of science degree in statistics. His research interests include the use of GIS and statistics to support environmental research and conservation