iPad Automates Field Data Collection for ADA Compliance Planning
By Kevin P. Corbley
Mishawaka, Indiana, took a major step in 2012 toward documenting its compliance with the sidewalk and curb ramp accessibility standards that are mandated by the Americans with Disabilities Act (ADA). The city of 50,000 residents adopted a quick and accurate method of collecting the required self-assessment information with assistance from college interns using iPads and digital mapping software.
“We now have all this data about sidewalk slabs that have been damaged or lifted…so we can prioritize when we are going to correct them,” said Gary West, Mishawaka’s Director of Engineering.
 He explained that because the sidewalk and curb assessments are in digital form and include GPS photos, the city will input the information into a separate layer in its GIS. There, the Engineering Department will plan and budget for repairs and then track progress over time. Just as importantly, it is using the data to create the Self-Evaluation and Transition Plan for outside infrastructure that must be filed with the federal government under ADA regulations.Located in Northern Indiana, the city lies at the crossroads of two major Midwest transportation routes, Highway 31 and the Interstate 80/90. To remain eligible for federal highway funding, the city must comply with those elements of the ADA that pertain to transportation infrastructure. These include intersection pedestrian curb ramps and sidewalks, which are required to meet specific accessibility guidelines to accommodate people in wheel chairs or with disabilities that hinder mobility.
Originally put into law in 1990, the ADA was updated in 2010 by the U.S. Justice Department which put the word out through various federal and state agencies that local governments should file initial compliance transition plans by yearend 2012. These must include inventories of the infrastructure and facilities in question with assessments of whether they meet existing ADA standards and what must be done to bring them into compliance.
Mishawaka selected DLZ Corporation, an engineering, architecture, planning and surveying firm headquartered in Columbus, Ohio. Over several years, the city had contracted DLZ’s nearby South Bend office for a variety of road construction projects. Just in time for the ADA self-assessment, the firm had developed a custom mapping and field data collection solution using the GPS-capable and camera-equipped iPad 2 running a mobile data collection app called GeoJot.
According to John Nelson, a DLZ Project Manager, the firm had already deployed the system for federally mandated street sign inventories in other cities. The field data collection app on the iPad proved so easy to use that DLZ was able to offer the service at a reduced rate by training college interns to perform the field work, which appealed to the Mishawaka Engineering Department.
Field Data Collection
 Mishawaka is a long-time user of GIS technology. The Engineering Department relies on the mapping database to plan construction of sewers to serve growing areas of the city. For at least the past 20 years, the city has included curb ramps in the construction or repair of street intersections. However, it had never specifically mapped their locations, and nor had it documented the conditions of sidewalks. The 2012 mapping project initiated the creation of a new layer in the city’s GIS.
Field data collection is a service DLZ often performs for its clients, usually involving the mapping of feature locations along with recording of specific attribute information. Having experienced frustration with inflexible data entry capabilities and poor camera quality on other GPS-based field mapping devices, the firm gave the Apple tablet a serious look as a field data collection tool shortly after the iPad 2 was released.
The large touch-screen appealed to field crews, and the introduction of built-in GPS and digital compass in the 3G models of iPad 2 tablets made them legitimate mapping tools. DLZ also liked the quality of photos captured with the iPad, explained Nelson: “The photos from our previous data collector were comparative to a flip phone – pretty rough – not the best for expanding and enlarging.”
A quick Internet search found the GeoJot field data collection app, developed by GeoSpatial Experts of Thornton, Colo., to turn the iPad 2 into a GIS data collection system. The Colorado firm created the GeoJot app for mapping professionals as a companion to its photo-mapping software, GPS-Photo Link. Both the mobile app and mapping software have since been incorporated into the GeoJot+ field data collection system.
Running on the iPad, the GeoSpatial Experts’ technology was attractive for its ability to synchronize GPS, photos, and attributes, enforce quality standards, and then output the georeferenced information as Esri shapefiles and Geodatabases, Google Earth files and other formats.
For project managers at DLZ, the primary value of the solution was found in the simple creation of attribute collection lists in GeoJot. Once created, these lists appear on the iPad screen as pull-down menus that guide the user in collecting detailed descriptions and measurements of the features being mapped. The lists can be shared among devices to ensure every field team was collecting identical data.
“We performed test runs with the iPads versus traditional pen-and-paper data collection,” said Qasim Asghar, DLZ Project Engineer. “[The iPad method] was a lot faster and more accurate.”
Taking it to the Streets
In preparation for the Mishawaka field work, DLZ landscape architects who deal with ADA regulations on a routine basis studied the amended 2010 ADA standards pertaining to facilities in the public right of way. They used the published self-assessment guidelines to create lists of the data that had to be collected along sidewalks and at intersection curbs for the city to develop its compliance plan. Created as menus in GeoJot, these lists drove the field work.
“There were 10 types of measurements or descriptions that had to be captured at curb ramps, and half as many for sidewalks,” said Asghar. “Curb ramps were more complicated because they involved multiple measurements [including slopes].”
Once the two field data collection lists were written in the app on the iPad and double checked for accuracy against ADA regulations, the actual field work did not require an engineer or GIS professional. DLZ perused the stack of resumes it gets every year from local college students looking for summer internships and selected four. Three students were studying construction management and one was majoring in landscape architecture. All were from Indiana colleges, and they received college credits for their work. The city engineering department welcomed their involvement.
“Training the students to collect data on the iPad was very, very easy,” said DLZ’s Nelson.
Beginning in May 2012, the student field crews hit the streets of Mishawaka five days a week until mid-July. Traveling on foot, they traversed all 240 miles of sidewalks in the city and mapped more than 1300 intersections with curb ramps. The four students divided into two two-person crews, one for sidewalks and the other for curb ramps.
The sidewalk team traveled together but worked separately, each with an iPad. Typically walking down either side of a street within sight of each other, the students kept their heads down looking for large cracks, potholes, uplifted concrete slabs and other damage that might impede a wheel chair or trip a physically challenged pedestrian.
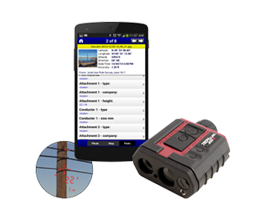
When significant sidewalk damage was found, it was identified by type and appropriate measurements were taken – such as the height of a heaved slab. A GPS photo was taken from at least one angle using the built-in camera. The iPad 2 model with 3G connectivity automatically geotagged each photo with latitude/longitude coordinates. The GeoJot app enhanced the native accuracy of the GPS points to 3-5 meters. The attribute data and measurements were entered into specific data fields on the iPad touchscreen.
They documented a lot of sidewalk damage, according to Mishawaka’s West. “We are in the snowbelt, and we hit the sidewalks with snowplows and pile them with salt…plus the roots of maple trees lift the slabs.”
The two-student curb ramp crew carried one iPad and worked together for the sake of safety and accuracy. At every ramp, the iPad digital camera was used to take a geotagged photo. One intern then used the smart level to get the required measurements while the other entered the results into the onscreen menu. The measurement taker usually had to step into the street for some of the work, and the other intern kept an eye on traffic.
“On average it took the crews about 5-15 minutes to collect the required data at each ramp,” said DLZ’s Asghar, adding this was half the time previously spent mapping assets with pen and paper..
Compared to pen-and-paper data collection, the iPad-based field data collection process enhanced information accuracy in several ways, he explained. Crews made fewer data entry errors when using a point-and-click menu. In addition, mistakes in transcribing field notes were eliminated because the data was collected digitally and uploaded into a computer afterward. Most importantly, there was no confusion in correlating hand-written GPS points with attributes because the GeoJot app automatically linked coordinates with photos and data entries.
Assessing Compliance
Once the data was collected in the field, it was transmitted wirelessly to a desktop computer running the GPS-Photo Link photo-mapping software in the engineering firm’s South Bend office. The software correlated the features and attributes for output in a variety of formats. Initially, spreadsheets were created so the firm’s engineers could review and edit the data, ensuring that all measurements had been made and that photos were satisfactory.
After the field work was completed, DLZ used the photo-mapping software to generate paper reports showing all of the photographs. With input from the city personnel, sidewalk and curb damage was rated High, Medium or Low depending on its severity. This ranking was added as an attribute. GPS-Photo Link data will eventually be added together with the sidewalk and curb ramp data as an ArcGIS shapefile for direct input into the Mishawaka GIS.
“Incorporating the information into the GIS helps on the management side of complying with ADA,” said Nelson. “Photos and descriptions can be sent digitally to city personnel or external contractors for quick cost estimates without additional trips to the field.”
For Mishawaka, the first order of business was to prepare initial ADA compliance plans for submission to the federal government. DLZ engineers developed a priority list of sidewalks and curbs based on a combination of their damage rating, location, and foot traffic. Well-traveled routes with the worst damage went to the top of the list, especially if there were near key destinations such as office buildings, shopping malls and government buildings.
Moving forward, the beauty of the iPad-based data collection is that all of the field information will be tied together digitally in the city GIS where photos and papers can’t get separated and lost, explained West. From a liability standpoint, the GIS will serve as the archive for new photos as repairs are made to enable the city to track its progress toward making its streets safe for pedestrians and compliant with federal regulations.
“This will help us document with the Federal Highway Administration to keep them posted regarding ADA compliance so we continue to be eligible for federal highway funding,” said West.
With the iPad-based technique verified in Mishawaka, DLZ is offering the service to other communities for ADA compliance planning, street sign mapping, and other asset inventories.
About the Author – Kevin Corbley is a business consultant specializing in geospatial technologies. He may be reached at www.corbleycommunications.