The last time Huntington, Ind., catalogued traffic signs was more than a decade ago, and the project involved spreadsheets and measuring tapes. This year, the city of 17,000 residents adopted a high-tech approach for a GIS-based inventory using iPads and digital mapping software in preparation for changes to Federal Highway Administration (FHWA)sign retroreflectivity standards.
“I am a big advocate of geospatial data,” says Anthony Goodnight, Huntington’s Director of Public Works and Engineering Services. “When you can see pictures and query data on a map, it’s so much easier to get information.”
Located near Fort Wayne in northeastern Indiana, Huntington decided to map the locations and retroreflectivity scores of its traffic signs after FHWA issued its May 2012 final rules revision to the Manual on Uniform Traffic Control Devices (MUTCD). Under the ruling, state and local agencies have until mid-2014 to implement a plan for maintaining sign retroreflectivity at or above levels established in 2009.
Retroreflectivity is a value that quantifies the ability of a surface to reflect light back toward its source. In the case of road signage, this increases visibility to drivers at night when their vehicle headlights illuminate the signs. Most modern traffic signs (stop, yield, etc.) have special backing and legend materials that make them more reflective. However, these materials degrade over time as sunlight and weather take their toll on the sign surfaces.
As will be true for cities and counties nationwide, Huntington will develop an upgrade and replacement strategy that is financially feasible and gives priority to worn-out signs. But before the signs can be replaced, they have to be evaluated and mapped.
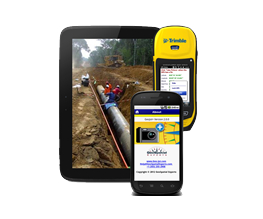
To perform the sign inventory, the city contracted DLZ Corp. (DLZ), a Midwest engineering, architecture, planning and surveying consulting firm. For similar projects in other cities, DLZ deployed a custom mapping and GIS data collection solution it had developed using GPScapable Apple iPad 2s and a mobile data collection app called GeoJot.
The maintenance of signs and other infrastructure in Huntington falls upon the Public Works and Engineering Services Department. For the last sign inventory in the late 1990s, field crews had taken to the city’s streets using measuring tapes to record the distances that traffic signs stood away from road centerlines or intersection corners. These location descriptions were entered into an Excel spreadsheet file with no connection to the GIS, which is shared by Huntington city and county. The department saw the MUTCD revisions as an opportunity to bring the sign inventory into the digital environment of the GIS.
GIS data collection is a service DLZ often performs for its clients, usually involving the mapping of feature locations along with recording of specific attribute information. Having experienced frustration with inflexible data entry capabilities and poor camera quality on other GPSbased field mapping devices, the firm gave the iPad a serious look as a GIS data collection tool shortly after it was released.
The large touchscreen appealed to field crews, and the introduction of built-in GPS and digital compass in the 3G models of iPad 2 tablets made them legitimate mapping tools. DLZ also liked the quality of photos captured with the iPad. “The photos from our previous data collector were comparative to a flip phone–pretty rough–not the best for expanding and enlarging,” explains Brian Nelson, DLZ project manager.
A quick Internet search found the GeoJot mobile field app, developed by GeoSpatial Experts of Thornton, Colo., to turn the iPad 2 into a mobile GIS data collection system. The Colorado firm created the GeoJot app specifically for mapping professionals as a companion to its longstanding photo mapping software, GPS-Photo Link. Both the mobile app and mapping software have since been incorporated into the GeoJot+ mobile data collection system.
GeoJot was attractive to DLZ for its ability to synchronize photos, attributes and coordinate points, enforce consistency and quality standards, and then output the georeferenced information as Esri shapefiles and Geodatabases, Google Earth files, .pdf reports, and .csv files.
The engineering firm used one of its iPads, the GeoJot app and the GPS-Photo Link photo-mapping software to test the bundle as a viable mobile GIS data collection solution. For DLZ’s Nelson, the definitive proof they had succeeded came almost immediately when their crews created a series of pull down menus to guide feature and attribute collection in the field. Compared to the GIS devices the firm used previously, the list-generation function on the iPad data collection app was easy to use.
After confirming the practical benefits of using the iPad-based solution for GIS data collection and mapping in several pilots, DLZ bought additional Apple tablets and apps for deployment in client projects.
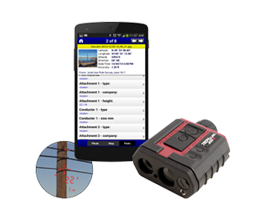
In preparation for the Huntington traffic sign inventory, DLZ turned to the MUTCD sign standards to devise an attribute collection list in GeoJot. This list directed the field crew member to enter specific pieces of information about each sign, either by pointing and clicking on pick list items or keying in customized responses. These attributes included the type of sign, its condition, obstructions and other vital details. (See the sidebar on attribute collection.) Survey rods were used to measure sign heights.
At each sign, the field technicians snapped one or more photos with the builtin camera. The iPad captured GPS oordinates of the location, and GeoJot enhanced the native accuracy of these points to the desired three-foot level. Then the crews gauged the retroreflectivity of each sign using a retroreflectometer from RoadVista of San Diego, Calif. These handheld units are about the size of a police radar gun.
“Most signs have two surfaces that must be measured–the background and the legend (or lettering),” says Nelson. “Our field technicians took four measurements from each surface and an average value generated by the retroreflectometer was used for the background and the legend measurements respectively.”
To measure the retroreflectivity of a surface, the technician placed the instrument directly against the appropriate part of the sign and squeezed the trigger. The device assigned a ‘shot number’ unique to each sign and recorded the eight retroreflectivity scores under that number. The shot number was keyed into GeoJot as the link between the scores and the other sign data. At the time, the technician was unaware of whether the sign passed or failed and moved onto the next sign.
“We started out using two members in each crew, but later had one person doing the collection,” says Nelson. “Once our crews became proficient, they averaged five to six minutes per sign, including the time needed to walk from one to the next.”
DLZ captured information for 2,500 traffic signs in Huntington over a period of 400 staff hours using the iPad data collection technique, including some office time.
At the end of each day’s mobile data collection, the crews returned to the DLZ Fort Wayne office with their equipment. Although they had an option of wirelessly transmitting photos from the field via the
cloud, the crews used the standard iPad connection cord to download the photos and attribute data from GeoJot directly into the GPS-Photo Link software running on a desktop computer. Likewise, the retroflectivity scores were transferred to an Excel file in Microsoft Office on the same computer.
The photo-mapping software gave Nelson and his team the opportunity to review and edit all of the attribute inputs and GPS points. They were able to quickly view the photographs, looking for sun
glare and other quality issues that may warrant a retake the next day. GPS-Photo Link charted the progress of the field work by annotating a satellite image of Huntington with icons showing the locations
of the photos. The crews used this to methodically move across the city without missing any streets.
DLZ performed a similar editing of the retroreflectivity scores by reviewing the spreadsheet to make sure appropriate measurements had been collected for each sign. The retroreflectometer data was output into an Excel spreadsheet. Nelson then created a temporary sign attribute file, also in Excel, as an output from GPS-Photo Link and then used the shot number identifier (an attribute in the field data gathered with GeoJot) to merge the scores, making them permanent attributes in the database
attached the appropriate signs in the photo-mapping software.
GPS-Photo Link then output the integrated data set as a GIS shapefile ready for ingestion as a new data layer in the Huntington GIS. DLZ delivered the shapefile with a digital file folder containing the photos, each stamped with time, date and location coordinates.
Integrating the sign inventory as a layer in the GIS is critical to Huntington’s ability to create a replacement plan, explains Goodnight, because the system can be queried on any of the collected attributes. For example, Public Works can search for all stop signs that failed the retroreflectivity test or that have tree branches obscuring their views. These can be displayed as icons on the GIS map. Personnel simply click on an icon to see the sign photo and other details.
“We’re going to be able to create lists of items that need to be addressed based on priority,” says Goodnight. “And we will generate work orders with the locations [of signs that need replacement].”
Due to budget limitations, Public Works has not yet decided how it will approach installation of new signs. It may query the system to pick out those signs whose backgrounds and lettering failed the retroreflectivity test so they can be changed first. DLZ is working with the city to establish a localized degradation rate of their sign backing materials so that they can project when signs will fall below the thresholds. The city will be able to monitor the degradation using their retroreflectometer and adjust the rate, perhaps buying more time and saving resources.
“We’ll get an idea of what the actual cost would be if we replaced all the signs that failed,” says Goodnight. “Then we’ll look at replacement options over a period of five or 10 years.”
Huntington is so impressed with the iPad-based GIS data collection system deployed by DLZ that it has already ordered its own tablets along with the GeoJot app. Initial plans call for equipping the Public Works crews with the tablet for use in sign replacement jobs. Beyond that, Huntington has already begun a pilot with its Water Department using the tablet and mobile data collection app to inventory other city assets. Attribute Collection
DLZ field crews collected the following attributes at each sign:
• MUTCD Sign Code • Installation Date (if marked) • Word Description • Type of Sign Background Material • Roadway Direction • Height • Size • Support Type • Support Foundation • Sign Condition (including retroreflectivity) • Support Condition • Location (via GPS) • Lateral Position of Sign • Digital Photo (via iPad) • Sign Obstructions • Inventory Date